SpaceTime library
SpaceTime is a code library which takes the grunt work out of working with datasets with different spatial sampling, geospatial projections, and temporal sampling. It is offered as both an R library and a Python library.
R library (based on the Python library)
Github: https://github.com/alexburn17/spacetime_r
Python library
Github: https://github.com/alexburn17/spacetime_python
PyPi: https://pypi.org/project/spacetimepy/0.1.6/
Documentation
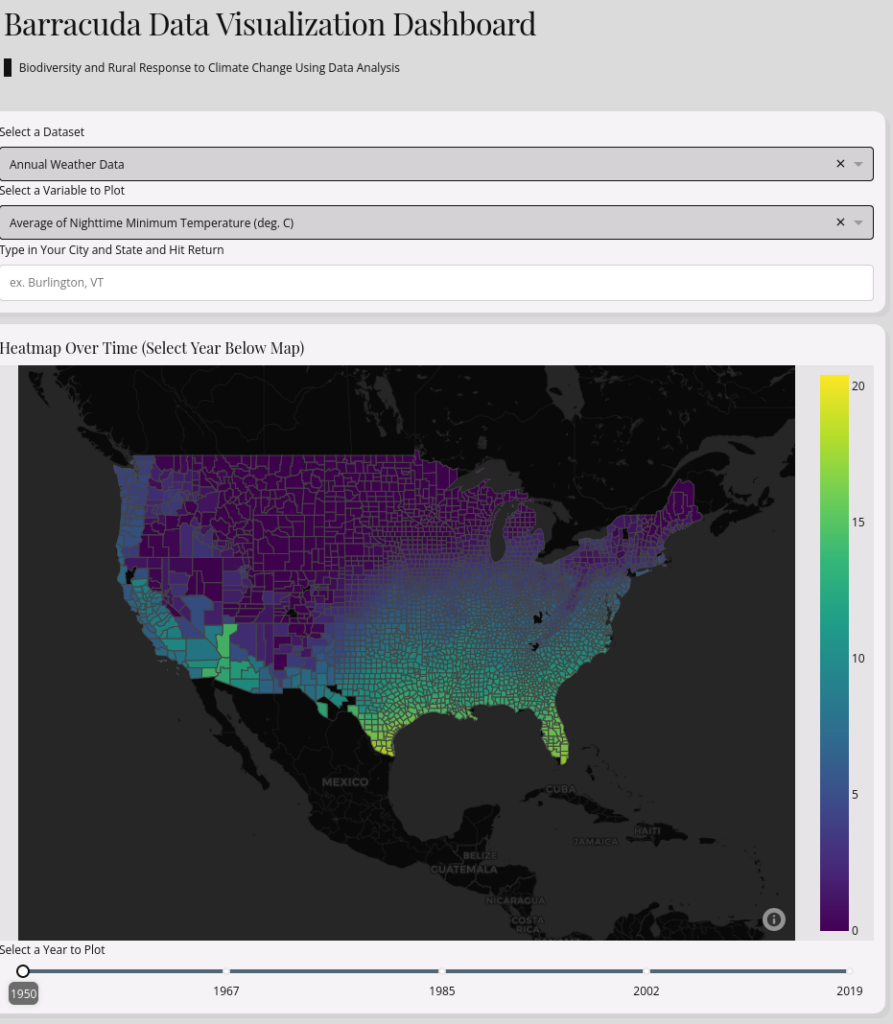
The Barracuda Dashboard
The dashboard will hold most, if not all, of the published datasets produced by the Barracuda team. It allows a user to explore and visualize the data in an intuitive way. It currently has the following interim data products:
- Pest atlas – Theme 1
- Crop model – Theme 1
- Species range shift – Theme 1
- Crop switching – Theme 2