Theme 1 – Natural adaptation to climate change
Pest species catalog
The pest atlas is a list of species which are of particular interest to our stakeholders. For each pest a range shift prediction is being computed and an accompanying pest overview page describing the pest and how a changing climate is expected to affect it.
This is an example for the Codling Moth (Cydia pomonella)
https://rpubs.com/lvash/1003137
Upcoming: Github repository
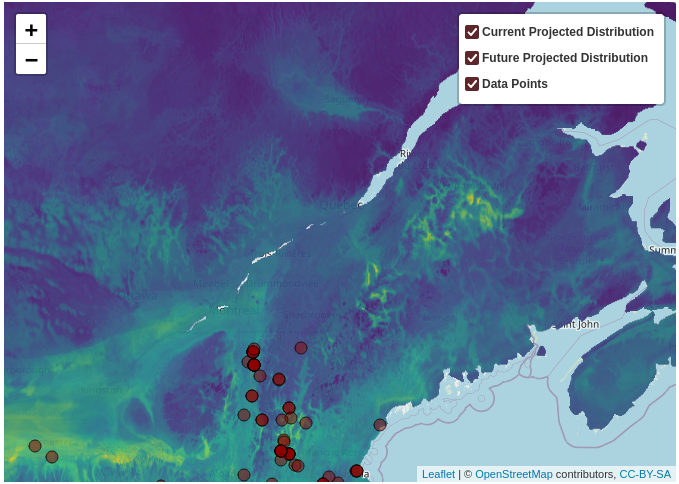
Species range shift model
A novel approach to stage based modeling of population growth through life stage survival tracking
Interim results are visible in the Barracuda Data Dashboard, below
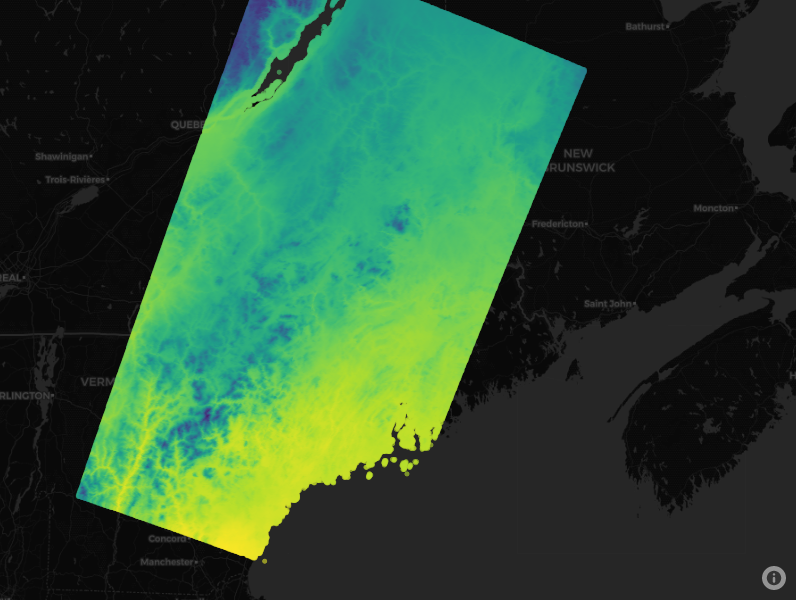
Crop physiology and Soil-Water balance model
A port to Python of the Excel spreadsheet model Modeling Physiology of Crop Development, Growth and Yield (2012) Soltani & Sinclair
The port is being validated against the spreadsheet outputs for a single location before running over a bounded geospatial extent for new crop types in a future with a changing climate.
Interim results are visible in the Barracuda Data Dashboard, below
Upcoming: Github repository
Theme 2 – Human adaptation to climate change
Theme 3 – Spatiotemporal data and models
SpaceTime library
SpaceTime is a code library which takes the grunt work out of working with datasets with different spatial sampling, geospatial projections, and temporal sampling. It is offered as both an R library and a Python library.
It is available on Github
https://github.com/alexburn17/spacetime_r
You can read the documentation, Vignettes, some history, and behind the scenes info here:
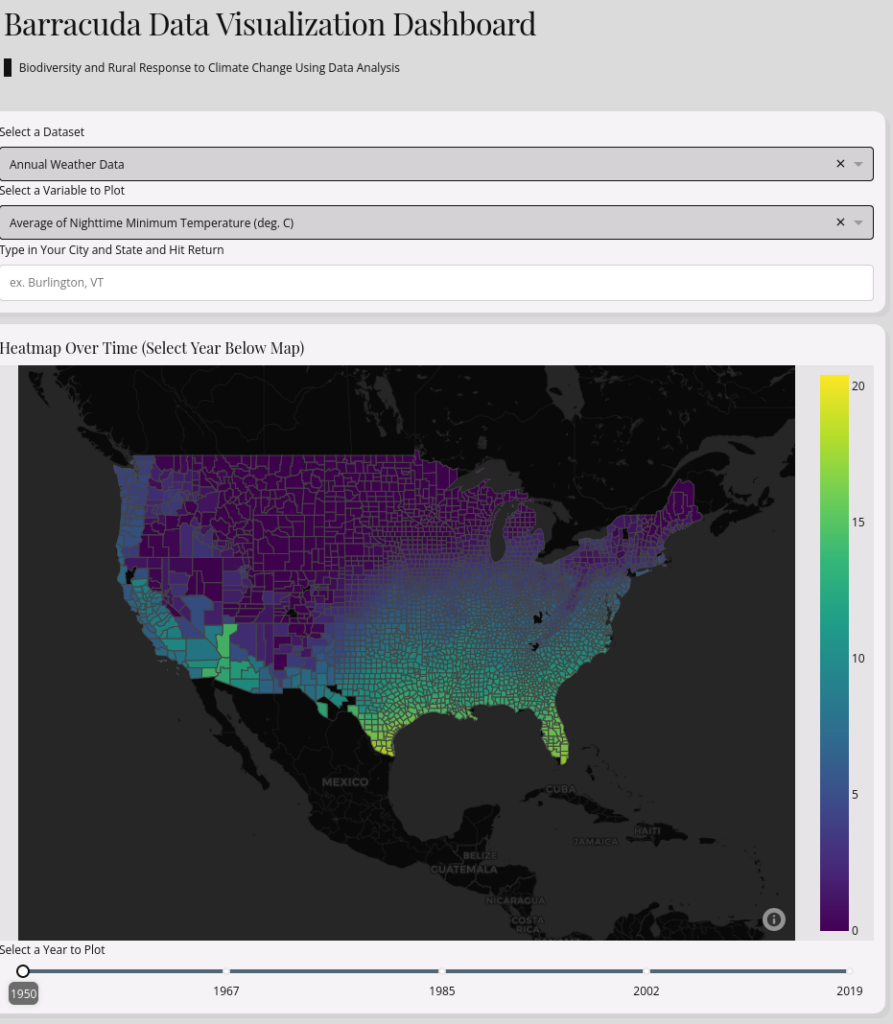
The Barracuda Dashboard
The dashboard will hold most, if not all, of the datasets which are produced by the Barracuda team. It allows a user to explore and visualize the data in an intuitive way. It currently has the following interim data products:
- Pest atlas – Theme 1
- Crop model – Theme 1
- Species range shift – Theme 1
- Crop switching – Theme 2
Theme 4 – Outreach and communication
A set of data science learning resources
https://github.com/lvash/Barracuda-Data-Sci-Resources
- Introduction to Programming
- Data Management and Wrangling
- Visualization
- Statistical Analysis
Provided by:
https://lvash.github.io/Barracuda-Data-Sci-Resources/#about-us